
We recently saw this graphic at the LinkedIn page of ‘owlg: Energy Decision Bureau’ and thought it was a great reference so wanted to dedicate a post to it.
In communication with Rosie Griffiths at owlg and insyn earlier today, we learned that she recreated a chart she had originally seen online for World Car Fee Day.
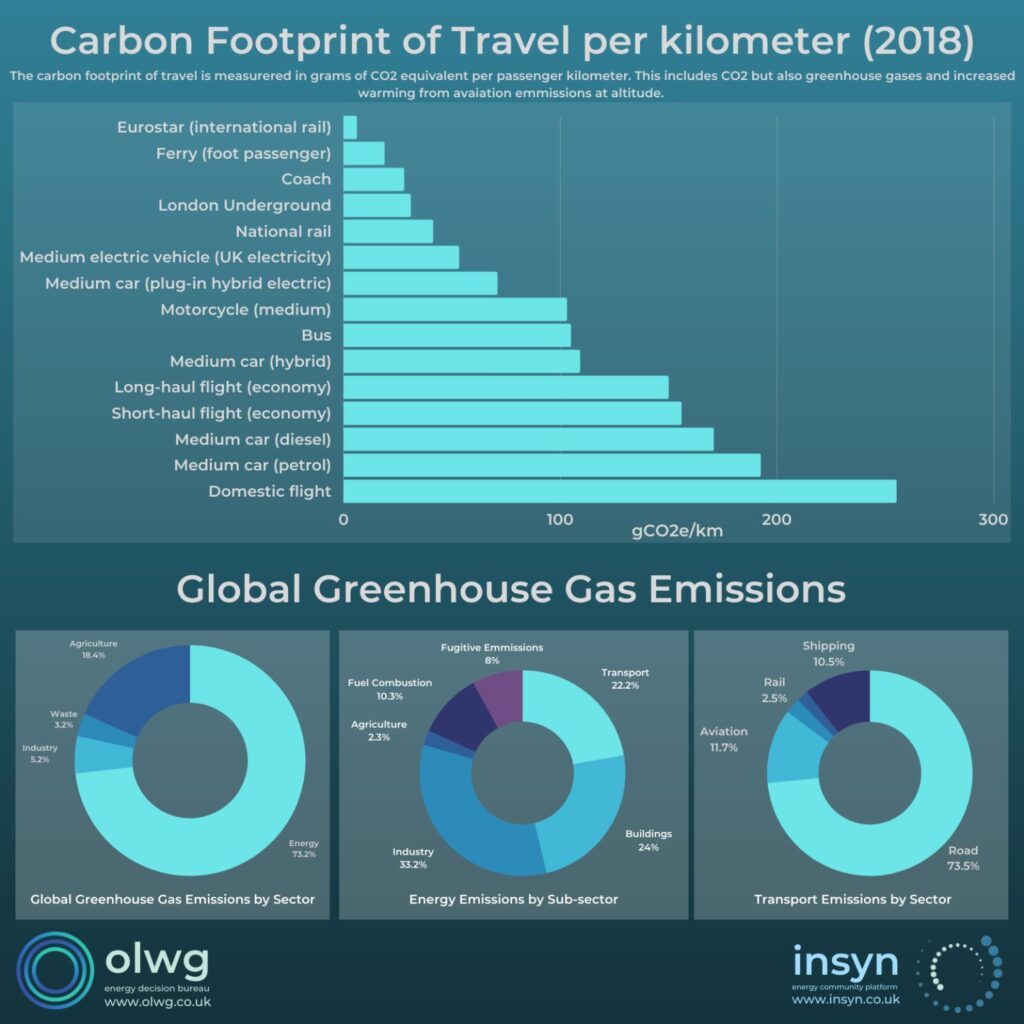
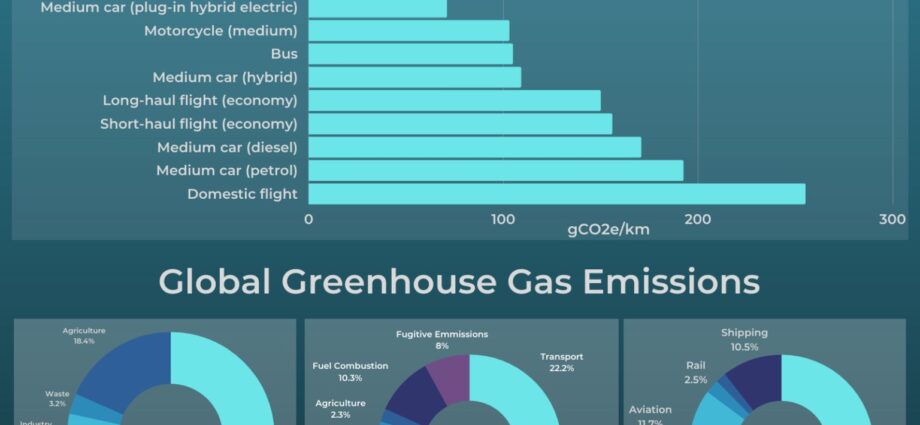
“Much focus is put on aviation being the highest in terms of carbon emissions, which is in terms of CO2 per km.” Griffiths noted. “However, cars are the largest contributor due to volume.”
To learn more about energy community platform insyn visit: https://www.insyn.co.uk